Using the MQTT Monitor to view data to the MQTT Broker
The Assetwolf IoT platform contains a helpful MQTT monitor system which helps in the set-up phase of a device and its connection to the portal. You can immediately see what data is arriving at the MQTT broker, even before it is received by the Assetwolf portal.
For this set-up, you will need to get MQTT Lens. In Chrome, go to Extensions, and then search for "MQTTLens" (without a space between the words), and then click Add to Chrome. You will then be able to start it from the Chrome App Launcher.
(If you don't have MQTT Lens, you can use a similar program, we suggest MQTT.fx as an alternative).
Once you've got the program installed, here's how to set it up and start seeing your data.
Here's an overview of what the MQTT Monitor will do:
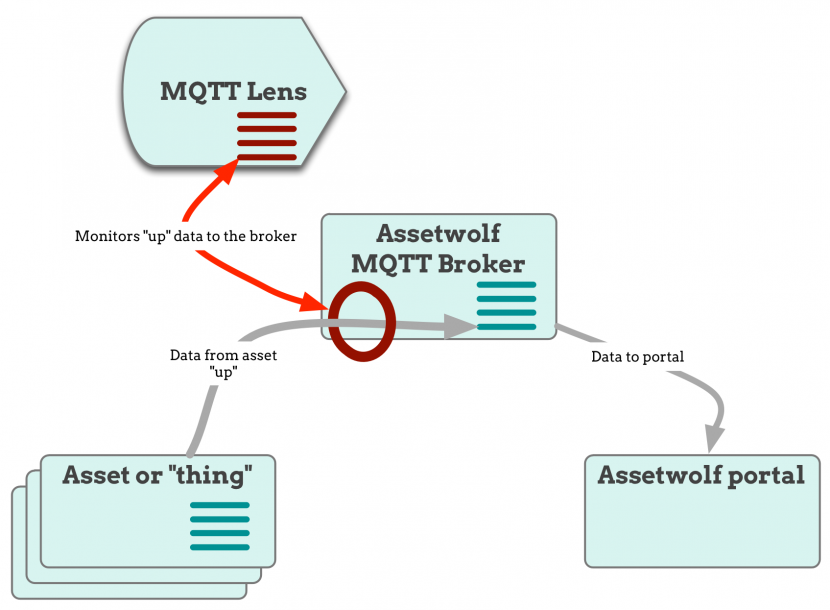
The diagram shows how the asset sends data "up" to the portal via the MQTT broker, and the MQTT Monitor lets you see it. (It's also possible to send data "down" from the portal to the asset, and it be monitored, this is not shown above but we will cover it in this article).
1. Make a new connection with MQTT Lens
In the Connections panel, click the + sign to make a new connection, and then enter the details as follows.
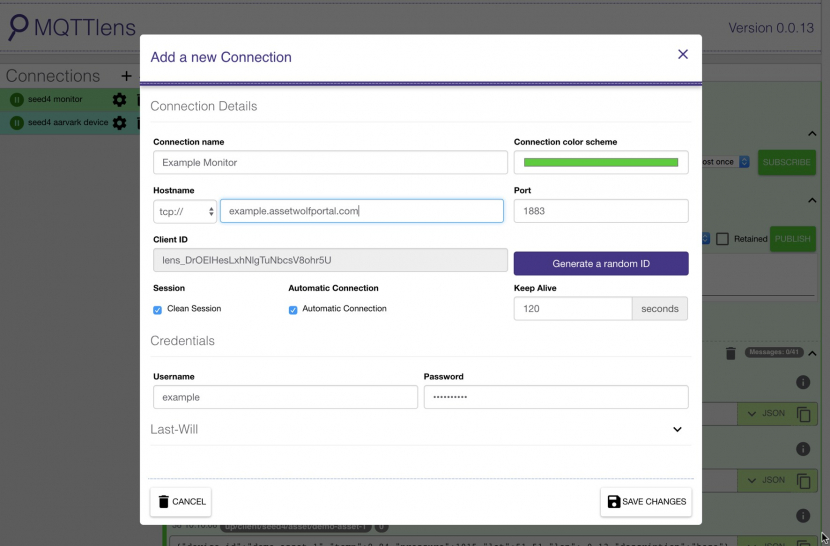
The key things to enter, as detailed in your portal, are:
- for the Hostname, select tcp:// and then enter your portal's domain name (e.g. example.assetwolfportal.com)
- Username for your portal: find this in your portal's Setup area, MQTT Monitor & Healthcheck, enter the MQTT Monitor Username
- Password for your portal: again in your Setup area, MQTT Monitor & Healthcheck, enter the MQTT Monitor Password
- Give your connection a name (in the top box).
Warning! Make sure you use the MQTT Monitor details, and not the Asset Connection Details.
The port number will be 1883 for trial or insecure connections, or 8883 for Secure connections. See more on this page.
2. Save your connection
You should see the connection you've made light up in green in the left-hand column, and MQTT Lens may confirm the connection has been established:
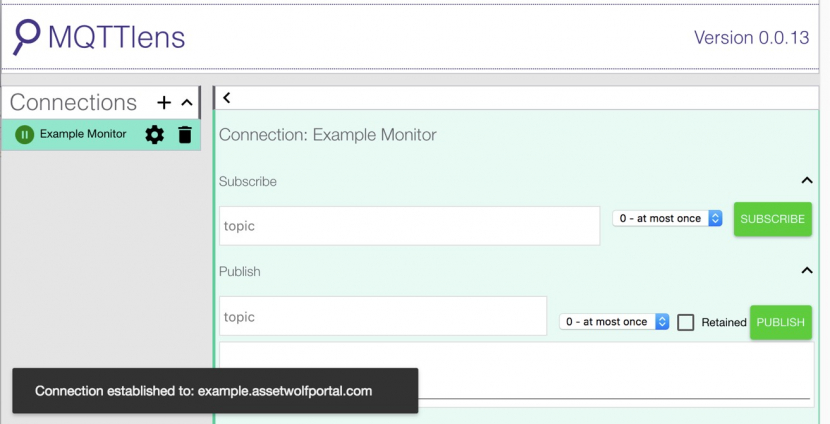
If you didn't see a green connection appear (it may be red if it fails) then please go back and check the connection details again.
3. Subscribe to the "up" topic
On your portal's Setup->MQTT Monitor & Healthcheck page you will find the device-to-portal topic, or the "up" topic.
Your MQTT Lens needs to subscribe to this topic. Remember that you subscribing to this topic, even though it is the device-to-portal one, because the purpose of the Monitor is to see what your device is sending to the portal. (You should not try to publish to this topic.)
The "up" topic will look like up/client/[sitename]/asset/+, replacing [sitename] with your site's name, such as like this:
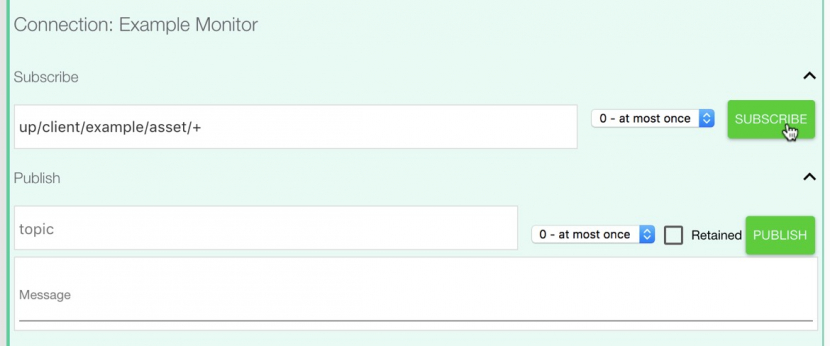
Note how the topic ends with a "+", a plus sign. This is a wildcard, meaning that you will monitor the data from all assets in your site that is going device-to-portal.
Press the Subscribe button, and wait a few moments for your device to send.
4. View the up-going data
Once your device starts to send data, it should be immediately visible in MQTT Lens. It should look something like this:
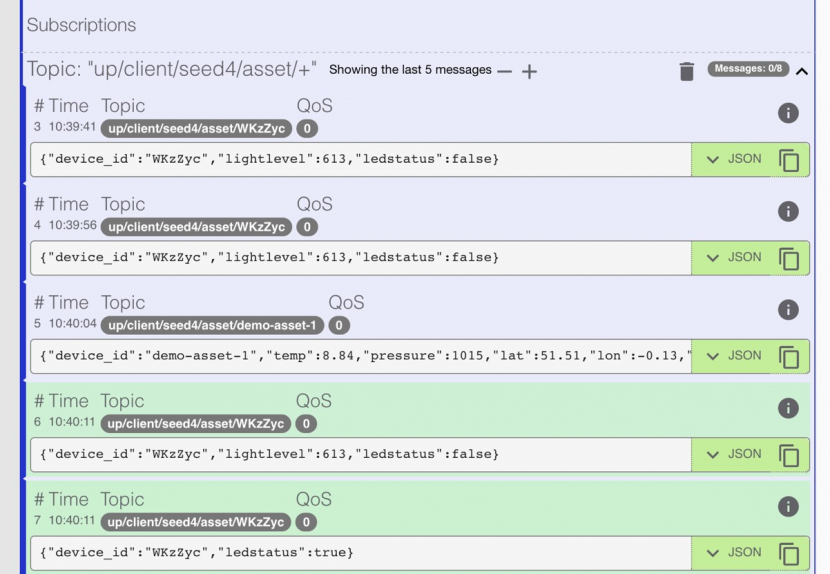
New messages may appear at the bottom highlighted in green, but will turn purple after a few moments.
5. Subscribing to the "down" topic to see bidirectional MQTT, commands to your device
If you are using bidirectional MQTT — sending data from your portal to an asset — then you may wish to subscribe to the portal-to-device, or "down" topic.
You can use the same MQTT Monitor connection as in steps 1-2 above, but this time subscribe to the "down" topic, which should have a name like down/client/[sitename]/asset/+.
Go to your portal and send a Command to your asset (how to do this). Note that if your device is normally in standby mode and communicates intermittently, commands may be queued until Assetwolf sees an incoming data frame; so it may take a few moments.
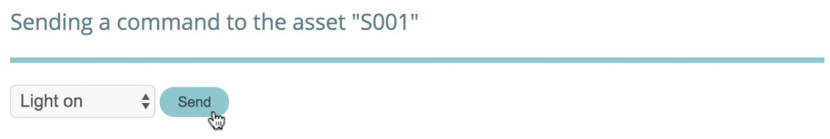
Here's an example in which a user has set up a "light-on" command and is about to send it from the portal:
When the data is sent to the device, you should see something like this:
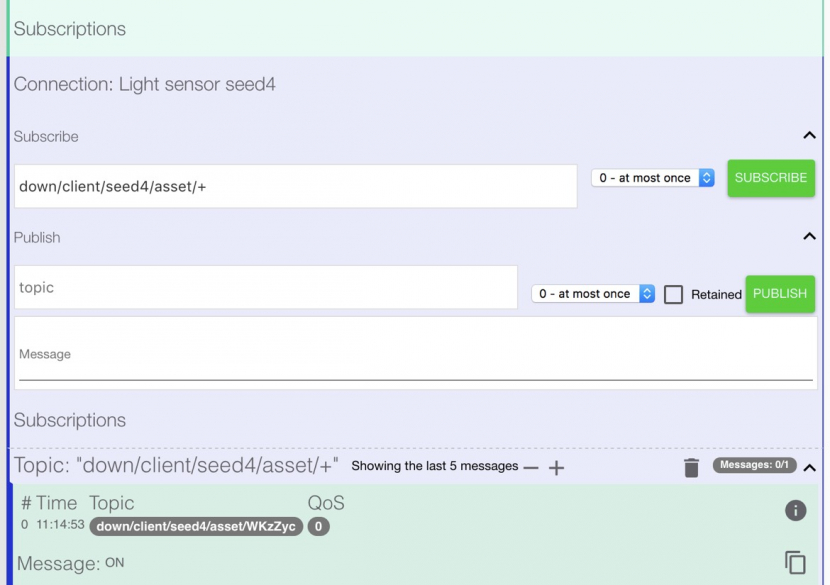
Notice the message is very short, just the string "ON" in this example.
6. The MQTT Monitor in use
The MQTT Monitor is a helpful tool for developers. You can see:
- all data being sent from your device, even if the Asset Type does not have fields in the schema
- badly-formatted JSON objects or data
- an instant view of the data in transit.